Global CO2 Concentrations
The following interactive displays trends in CO2 concentrations (averaged monthly) from 11 locations around the world (see the station globe below). Many factors influence global and local CO2 concentrations, including the carbon cycle, the distribution of forests (especially forests near the poles that experience strong seasonality), and the mixing of air masses between and within each hemisphere. Notice how the seasonal amplitude of atmospheric CO2 has recently increased at the high latitudes in the Northern Hemisphere.
Drag slider controls left or right to change x axis scale. Drag area between slider controls to pan left or right across plot.
The globe below shows the locations of the CO2 measuring stations. Only stations that are checked on the interactive graph are shown.
Hover over the marker for the station name.
This data comes from the Scripps Institute of Oceanography CO2 Program, which was started by Charles Keeling. The first measurements began in 1957 at La Jolla, California and at the South Pole, and in 1958 at Mauna Loa Observatory in Hawaii. The Mauna Loa CO2 record represents one of the most important scientific works of the 20th century and is known as the Keeling Curve. Mauna Loa is an ideal long-term monitoring site due to its remote location far from continents and its lack of vegetation.
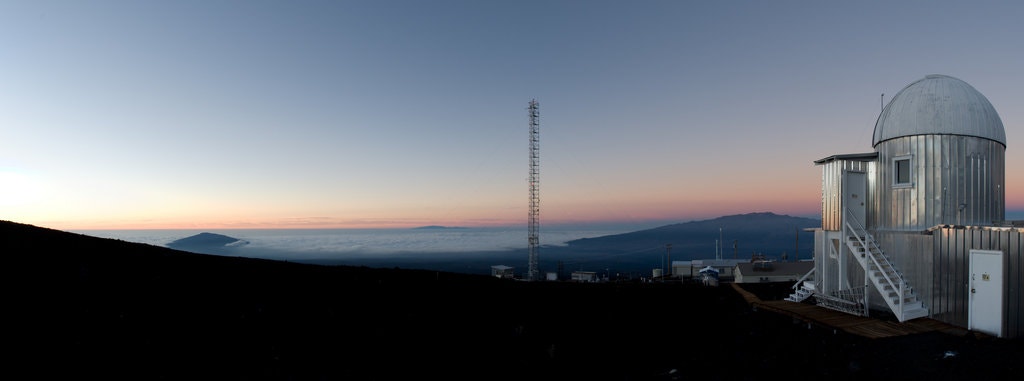 The Mauna Loa Observatory sits on a volcanic plain on the slopes of the Mauna Loa volcano in Hawaii,
11,135 feet above the Pacific Ocean.
The Mauna Loa Observatory sits on a volcanic plain on the slopes of the Mauna Loa volcano in Hawaii,
11,135 feet above the Pacific Ocean.
The Scripts CO2 program was expanded during the 1960's and 1970's to include an array of stations between the Arctic and Antarctica. To gain further insights, see the animation Carbon Dioxide Pumphandle 2019 by NOAA.