Ocean CO2 Time-Series
The oceans contain 50 times more inorganic carbon than the atmosphere because of its large volume and because CO2 dissolves in sea water. This data interactive explores how increasing atmospheric CO2 has been driving CO2 from the atmosphere into the ocean, resulting in ocean acidification (Caldeira et al., 2005).
The figure below shows time-series of surface water pCO2 and pH from three open ocean locations around the world. In addition, atmospheric CO2 concentrations from Mauna Loa are also shown. What are the long-term trends in the pCO2 data from HOT, BATS, and ESTOC? For a given location, what is the relationship between pCO2 and pH (lower pH is more acidic)?
Drag slider controls left or right to change x axis scale. Drag area between slider controls to pan left or right across plot.
The globe below shows the locations of the ocean time-series stations (one site in the Pacific, two in the Atlantic). Data for this interactive comes from the Hawaii Ocean Time-series (HOT) program, the Bermuda Atlantic time-series Study (BATS), and the European Station for Time-series in the Ocean Canary Islands (ESTOC) program.
Hover over the marker for the station name.
Images
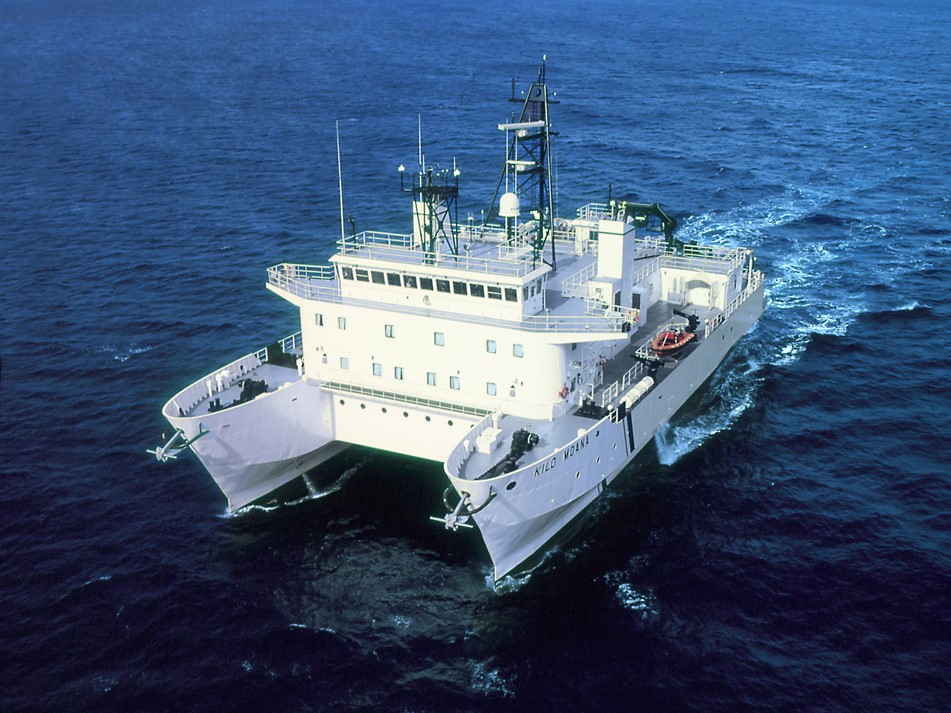
Research ship heading to the HOT station.
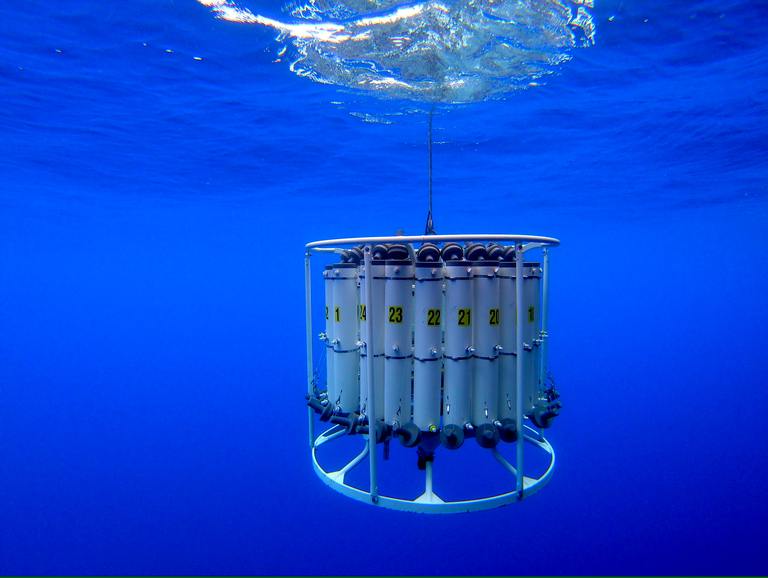
Surface ocean water samples are collected using Nansen bottles for chemical analysis.