CO2 in the Ice Core Record
Glaciers and ice sheets form as layers of snow accumulate on top of each other. Over time, the buried snow compresses under the weight of the snow above it, forming ice. Bubbles of trapped air become part of the ice as layers of ice accumulate year after year. The air bubbles act as time capsules, providing a direct measurement into the composition of the atmosphere when the ice formed.
Ice cores are cylinders of ice drilled from ice sheets. Layers in ice cores correspond to years, with the youngest ice at the top and the oldest ice at the bottom of the core. In Antarctica the ice sheet averages 2160 meters, with a maximum thickness of 4776 meters. By analyzing the chemical composition of bubbles trapped in kilometers-long ice cores, scientists can reconstruct the concentration of CO2 in the atmosphere going back hundreds of thousands of years.
The graph below shows the concentration of CO2 in the atmosphere going back two millennia. In addition to direct CO2 concentration measurements from Mauna Loa and the South Pole, this graph shows the concentration of CO2 in bubbles trapped in the Law Dome (MacFarling et al., 2006; Rubino et al., 2013; 119.87 m) and Siple (Neftel et al., 1985; Friedli et al., 1986; 200 m) ice cores. Notice the close correspondence between the direct atmospheric CO2 measurements and the ice core data.
Drag slider controls left or right to change x axis scale. Drag area between slider controls to pan left or right across plot.
The graph below takes us further in time. It includes the Taylor ice core (Indermuhle et al., 2000; 471 m) and the much deeper Vostok (Petit et al., 1999; 3623 m) and Dome C (Monnin et al., 2001; Siegenthaler et al., 2005; Luthi et al., 2008; 3,270 m) ice cores from the interior regions of East Antarctica.
Drag slider controls left or right to change x axis scale. Drag area between slider controls to pan left or right across plot.
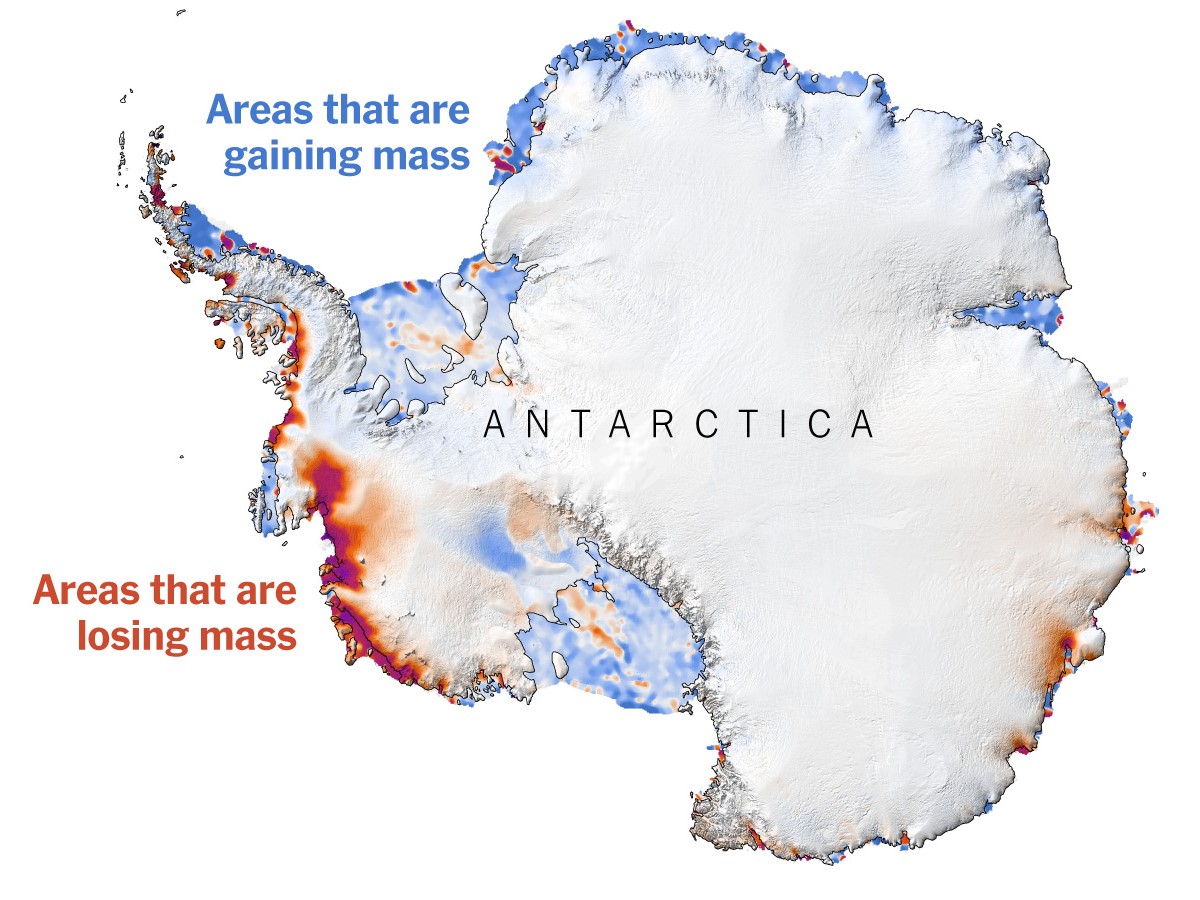
The map below shows the locations of the Antarctic ice cores as well as the stations where atmosphere CO2 was directly measured since the late 1950s.
Hover over the marker for the station name.
Images
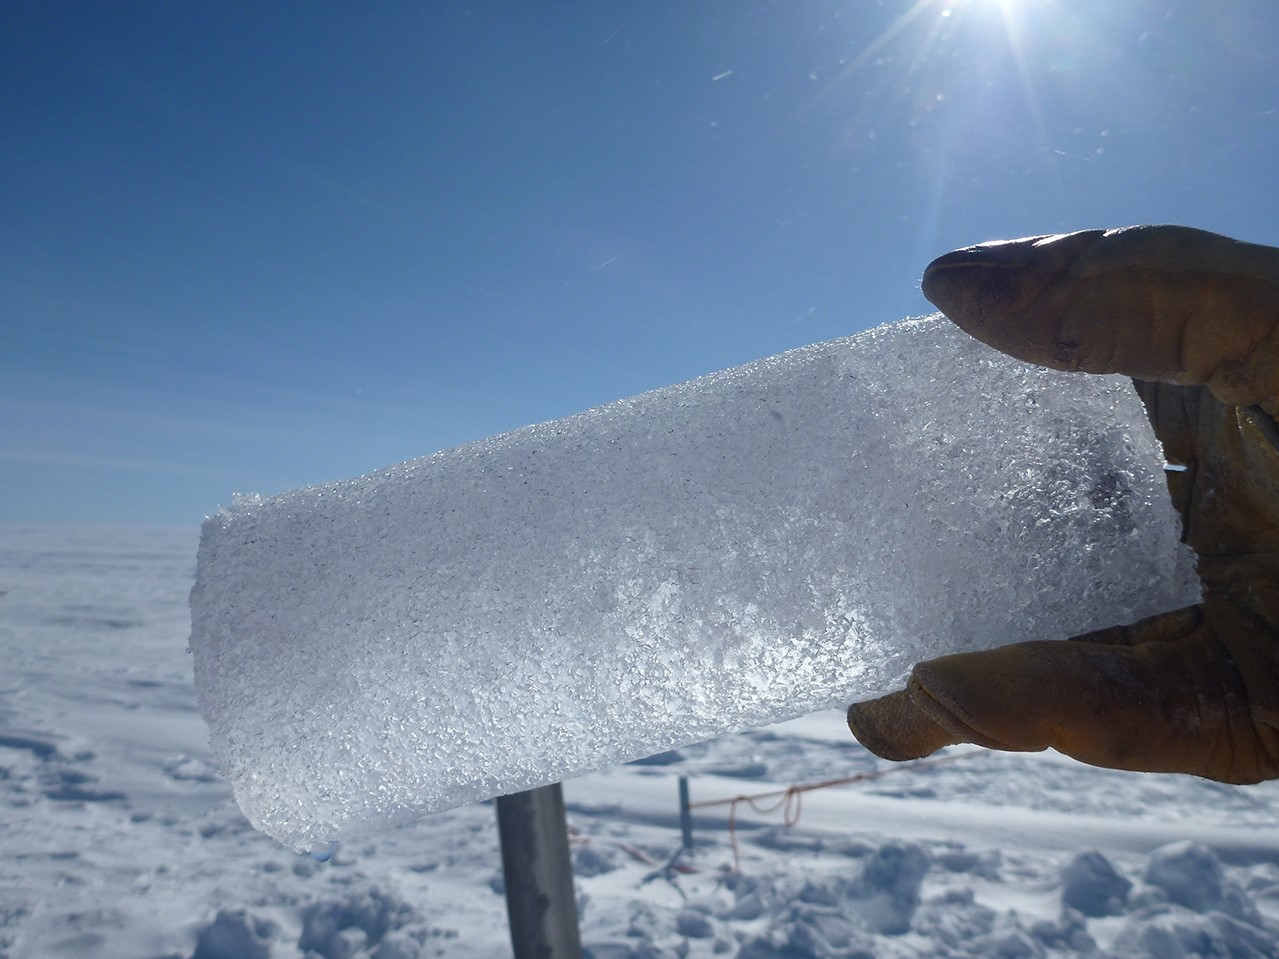
Gas bubbles trapped in an ice core.
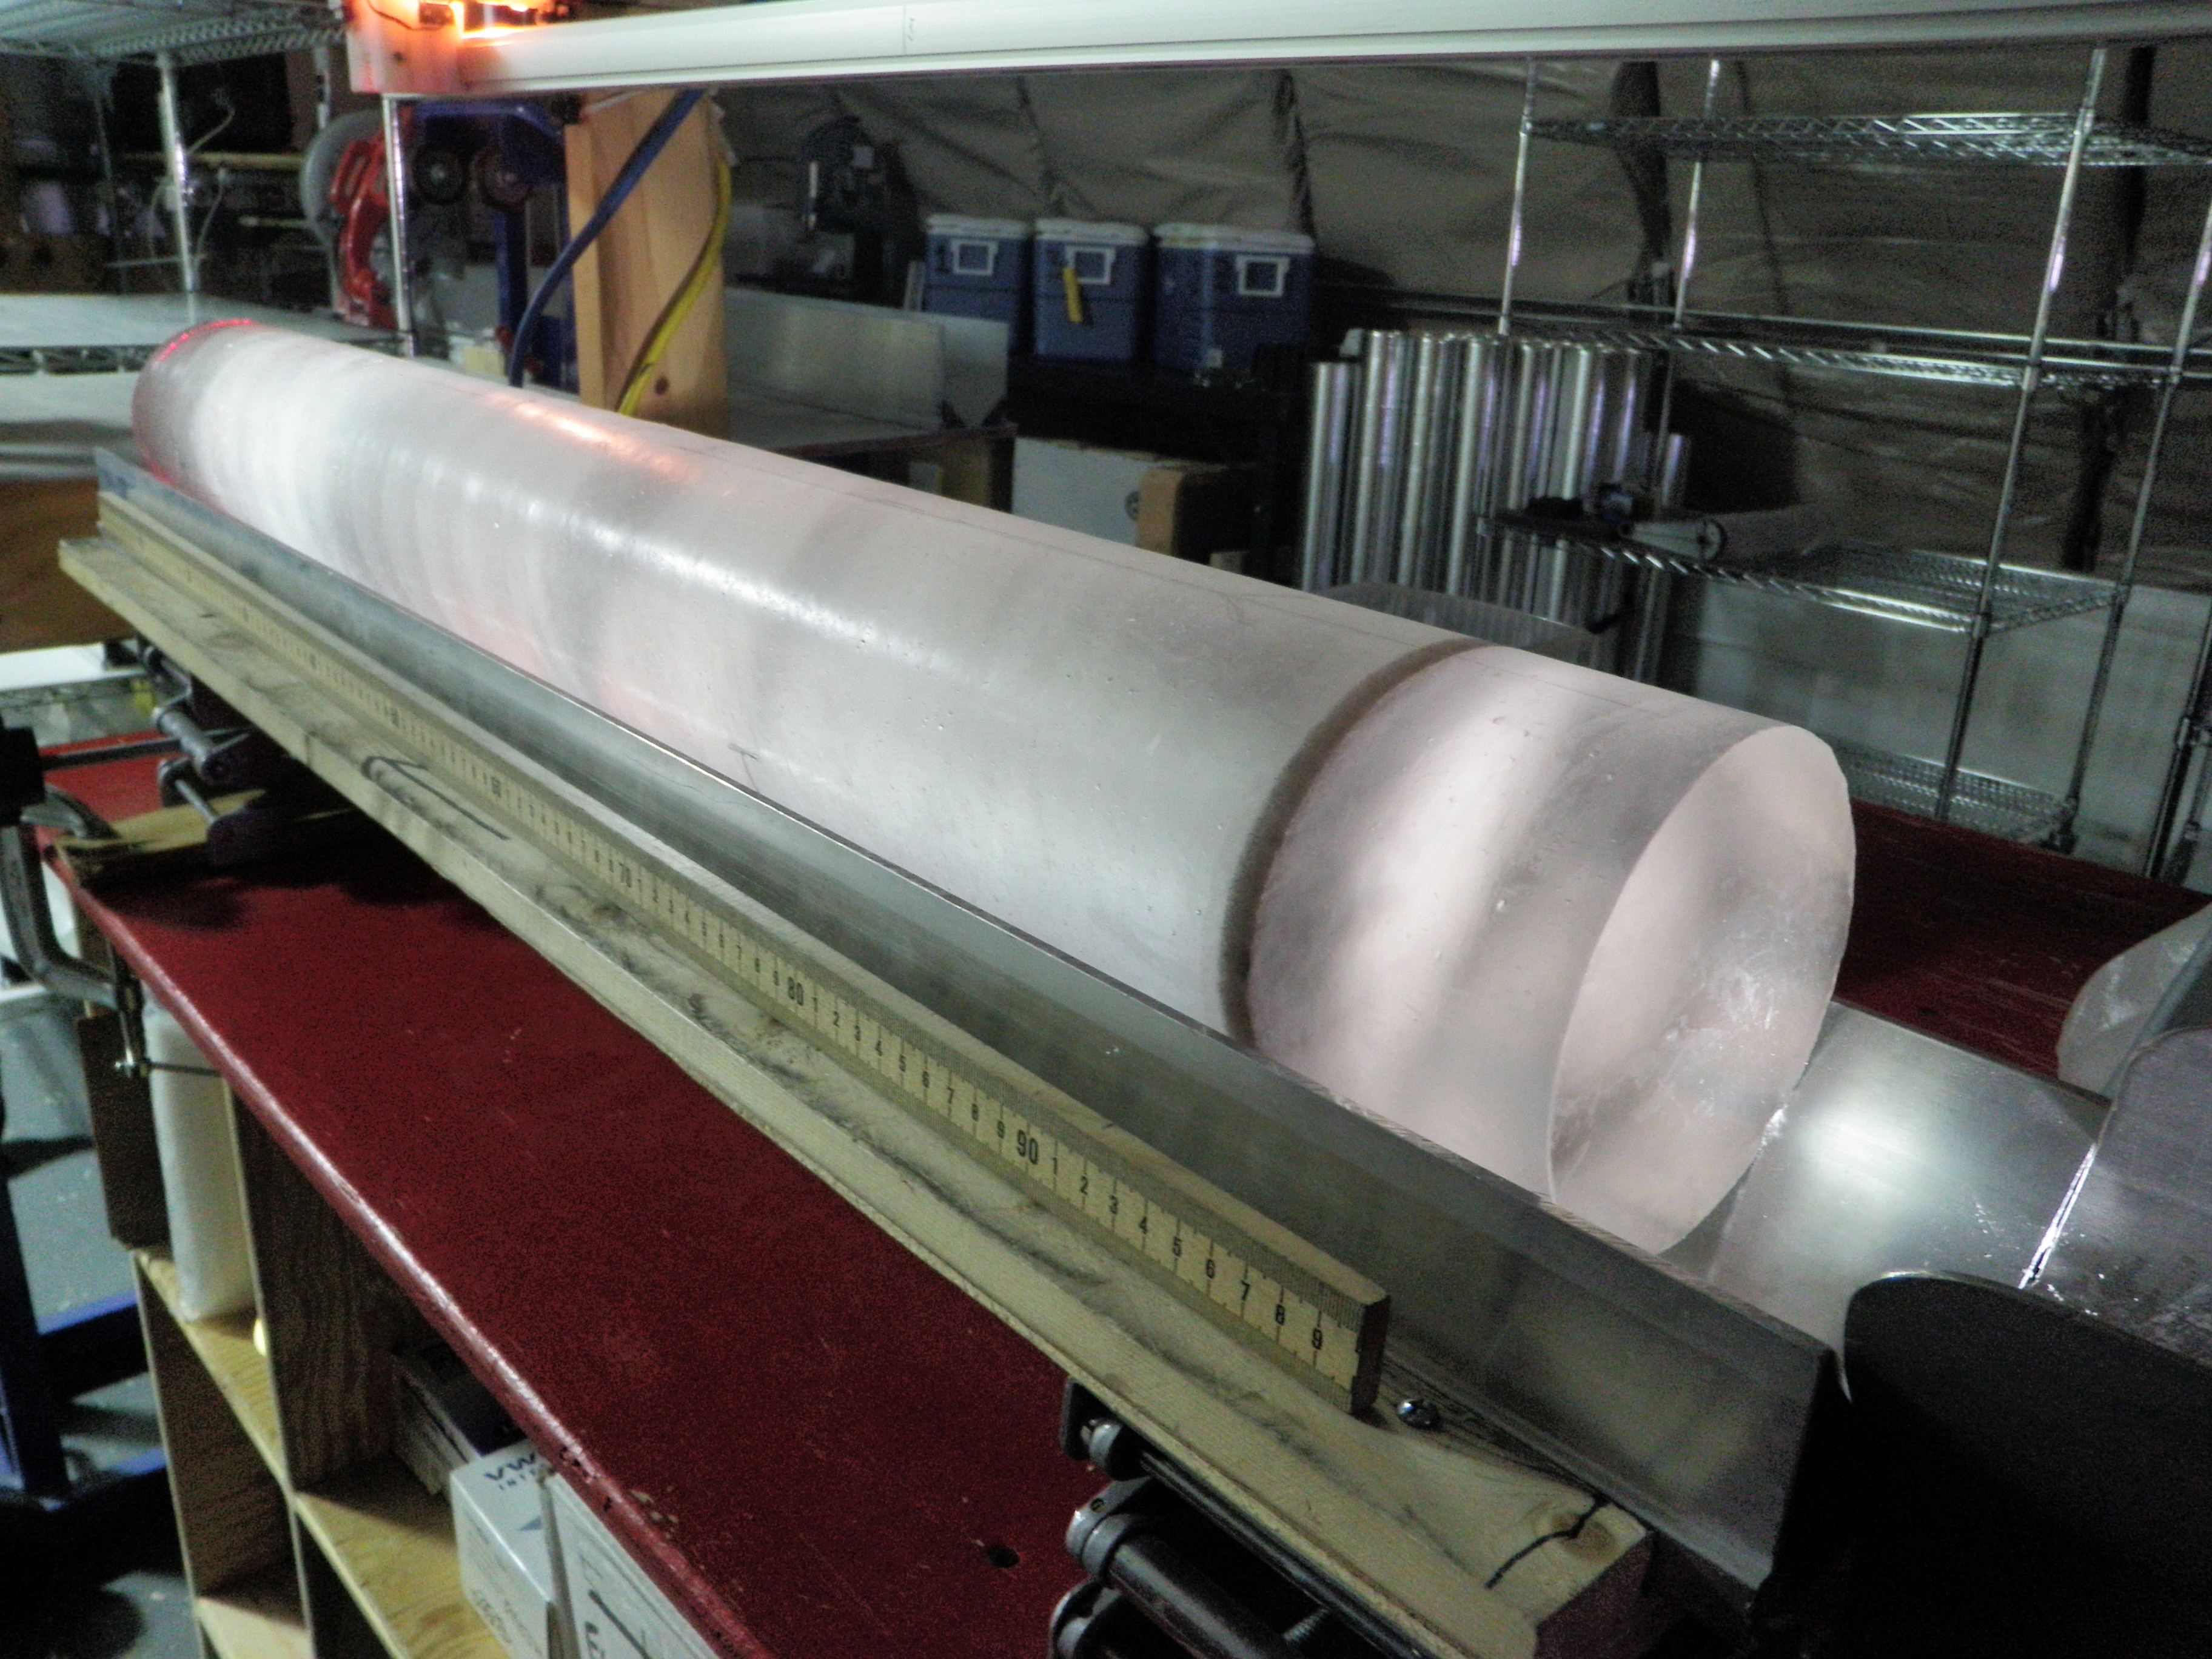
An ice core from the West Antarctic Ice Sheet Divide.
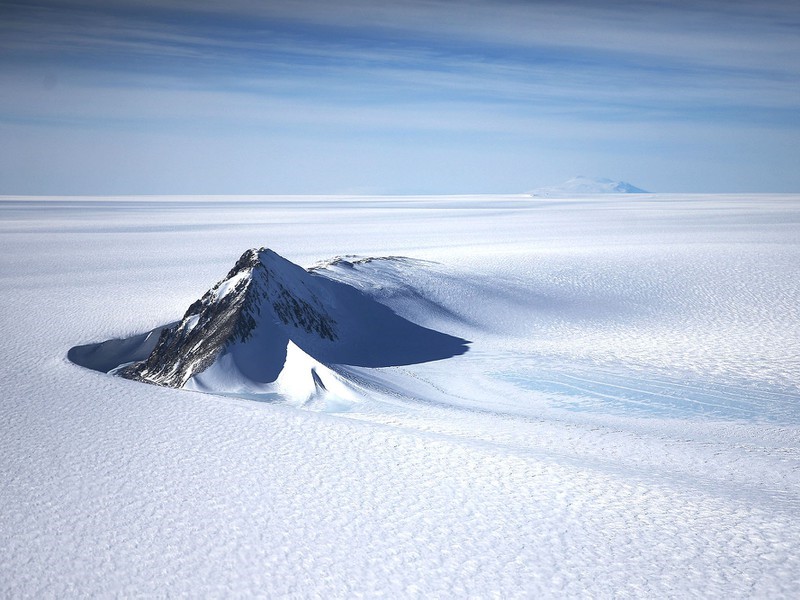
Section of the West Antarctic Ice Sheet with mountains.
Antarctic Ice Sheet averages two kilometers thick.
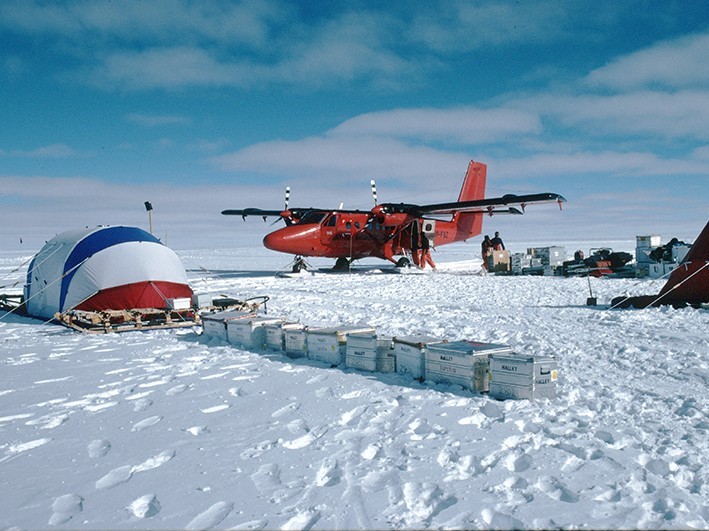
Preparing to drill a new ice core.
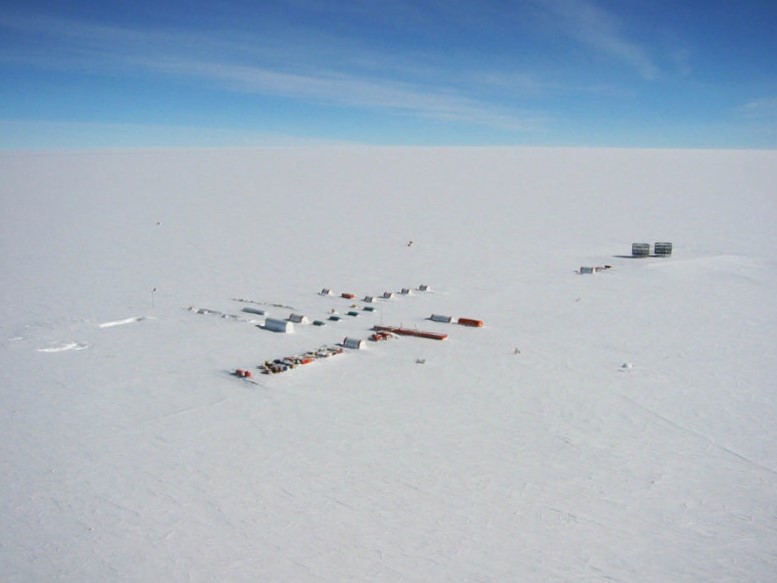
Concordia Station at Dome C (3233 m above sea level).
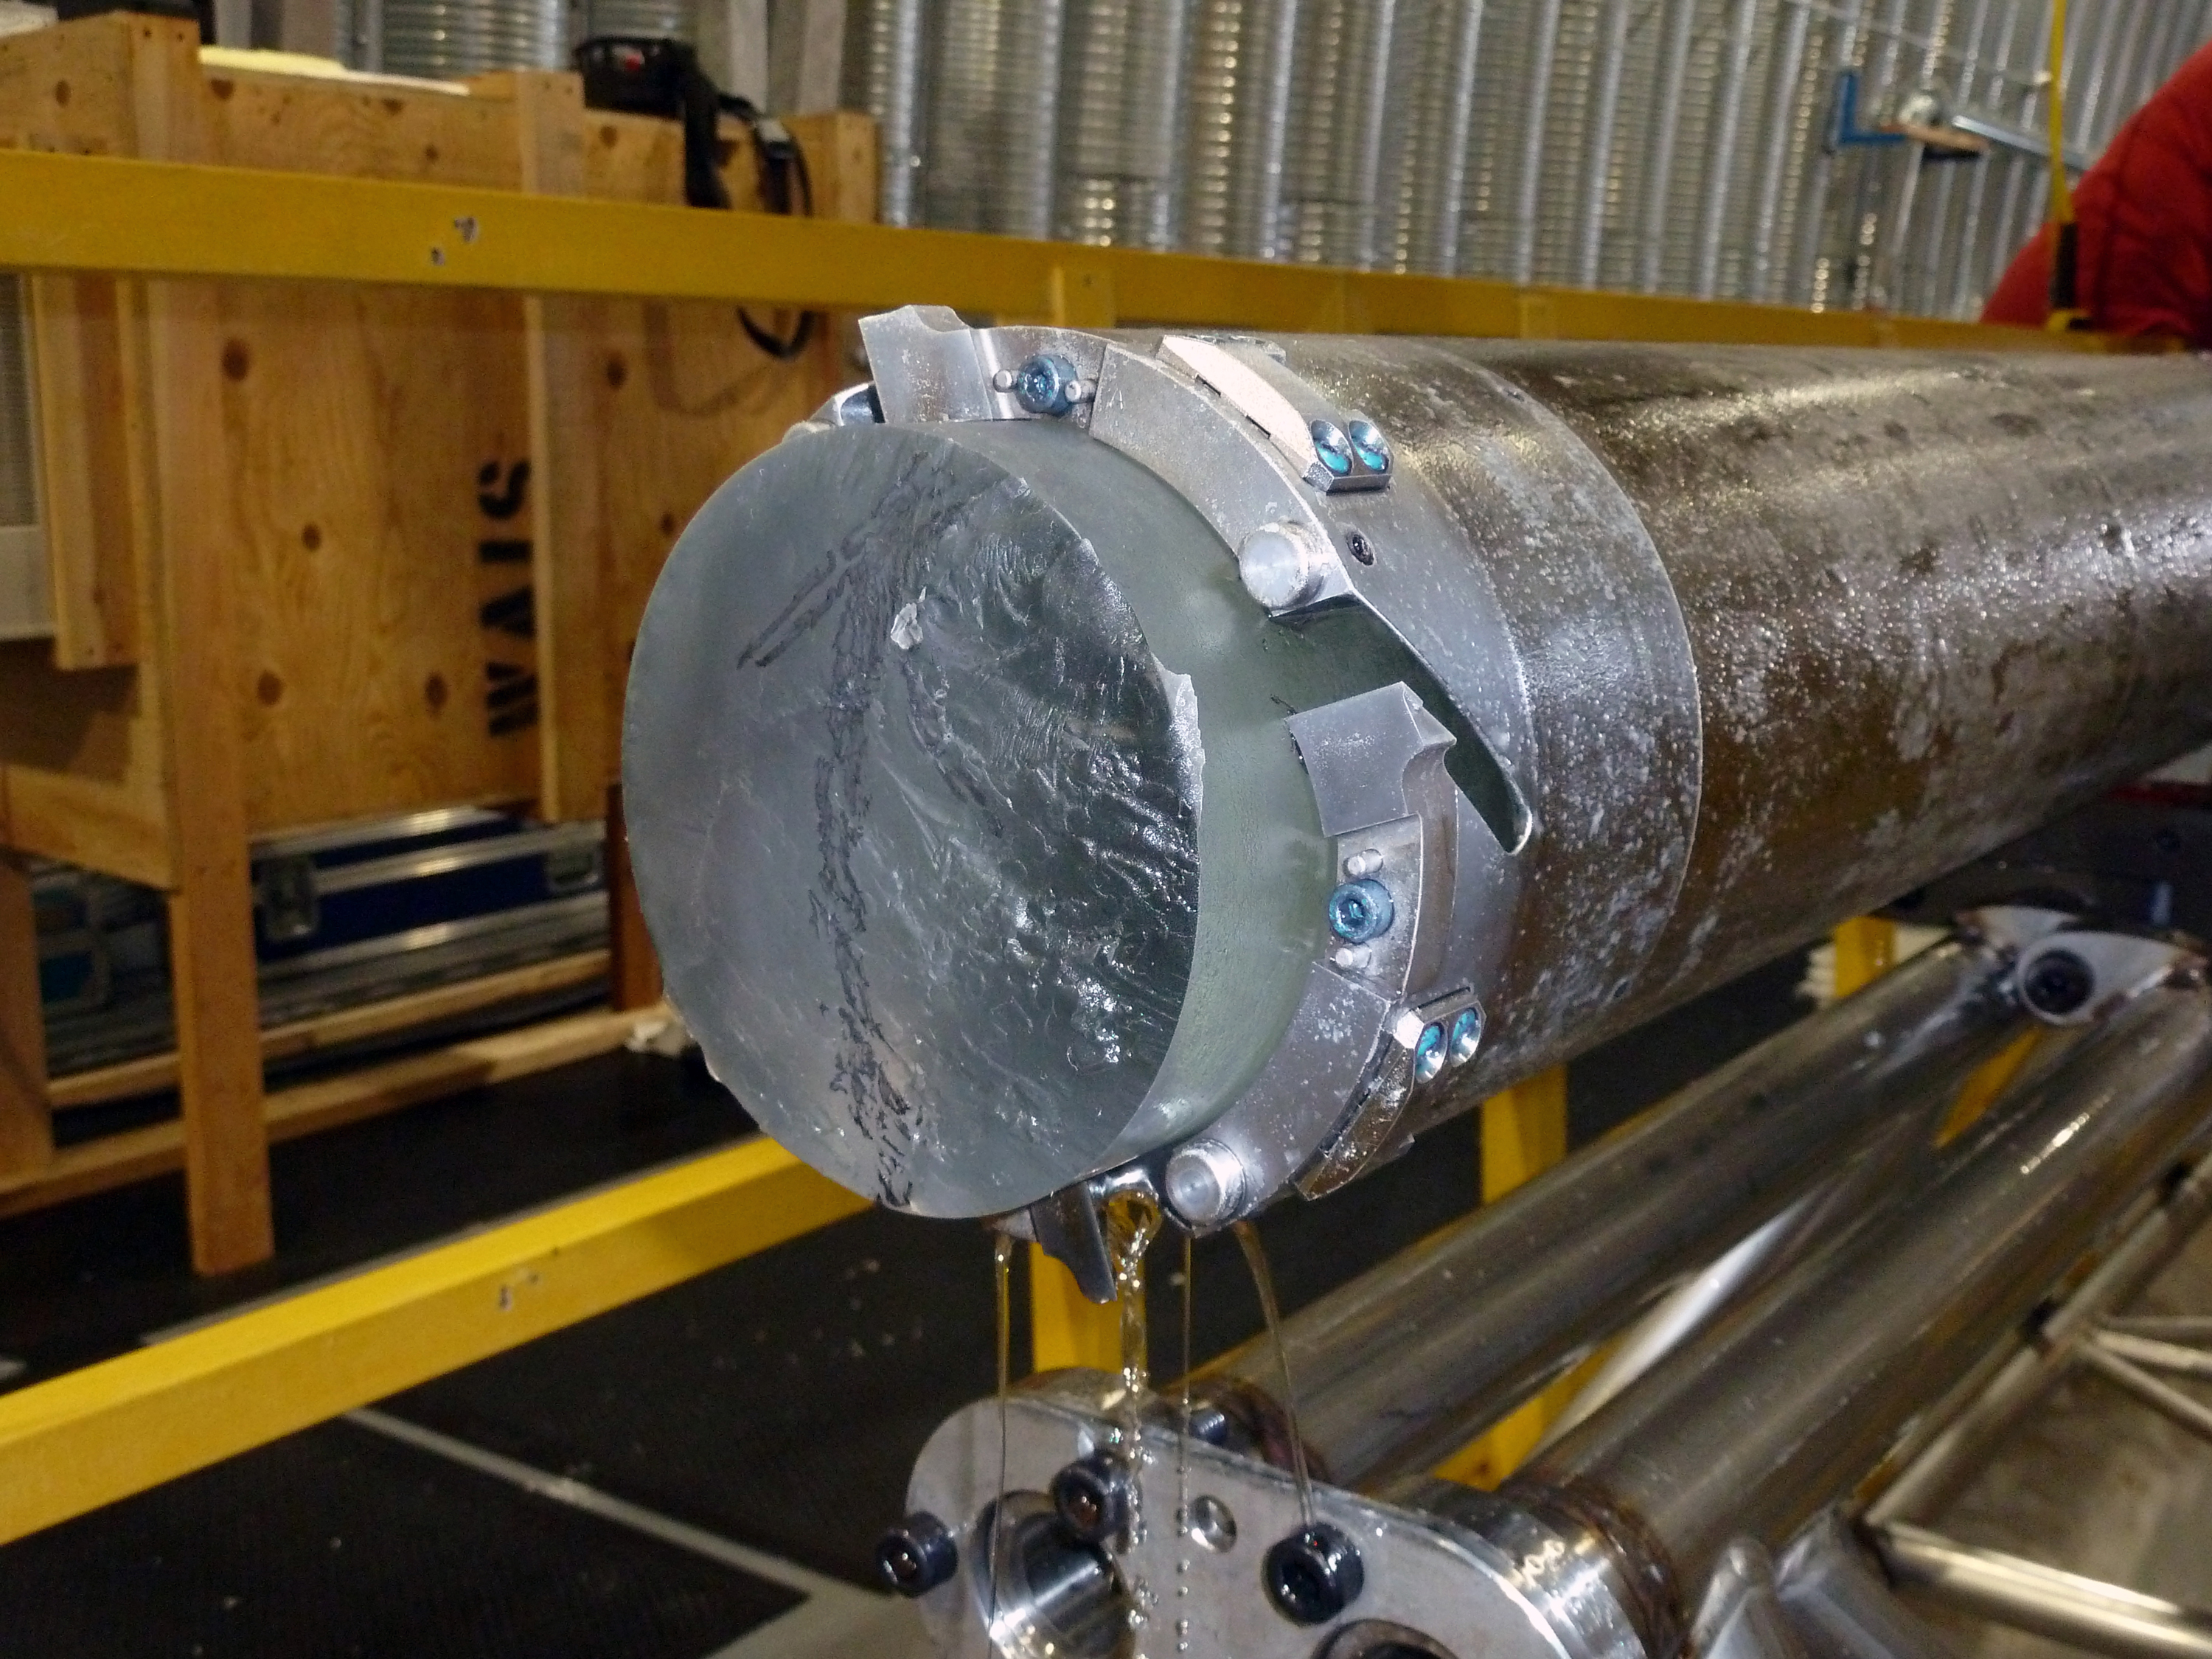
Drill's cutter head and core barrel with an ice core inside.
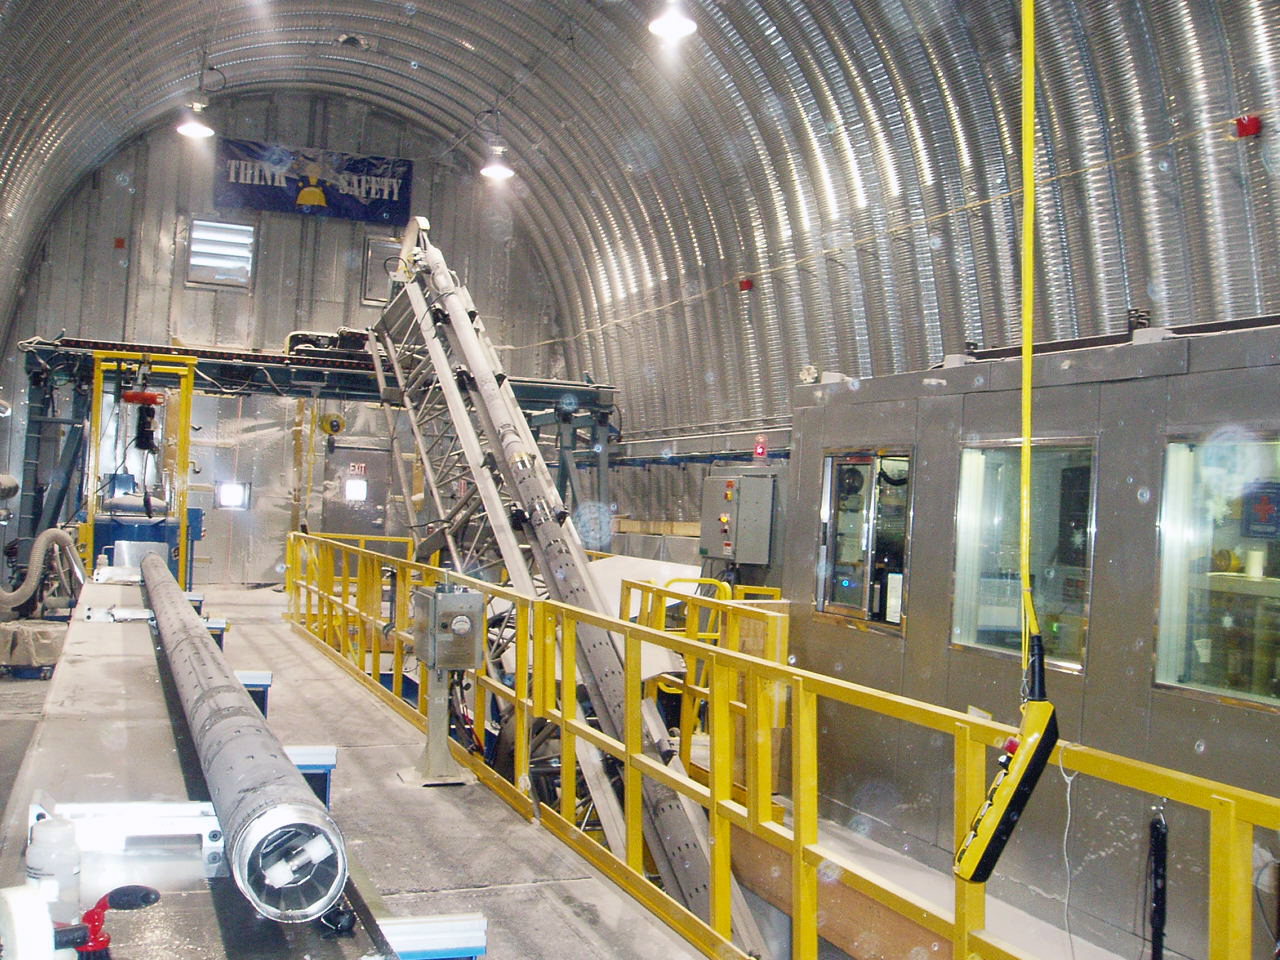
Drill tower tilts from vertical to horizontal.